Use Infographic Video Maker for Corporate Storytelling

Video remains the most effective content to tell your story.Infographics video maker will allow you to compile your figures
The periods of confinement linked to the health crisis have reinforced the need for companies to maintain contact with their audience, due to the distance. The other challenge for lesser-known companies was to gain notability, to get the word out, without being able to attend conferences or any other type of event, due to the restrictions.
Video therefore appeared to be THE type of content to produce in order to have a regular communication strategy and to get people talking about you. And web video editor appeared to be THE type of tool to use.
And when you want to tell your story, there will be a lot of data to compile (date, turnover,…). Infographic video maker therefore appear to be the easy tool to use for your teams.
But first, what is storytelling?
For many companies, and depending on what you sell, it can be difficult to differentiate yourself from your competitors. Take perfume for example: how can Jean-Paul Gautier differentiate itself from the competition? Through traditional and digital media, he can’t make his perfume smell. And besides, many perfume smells are similar. This is a way of creating a visual identity, and this is an integral part of storytelling.
For a company, storytelling means saying who you are, where you come from, and what values you stand for.
In your storytelling strategy, in order to present yourself to people who don’t know you, you will have to compile a certain amount of data, such as important dates, turnover per year, number of employees, etc.
So that all this data is not indigestible, the infographic video maker will allow you to put all this information into images, then into animation called infographic videos.
As a first step, choose the story you want to tell in an infographic video, and how it will look for viewers
What exactly do you want to tell in your storytelling video, which will take the form (in part or in full) of an infographic?
For example, and depending on your market:
– Tell the story of the meeting between your co-founders?
– The genesis of the project? How did the idea for your company come about?
– the evolution of your turnover?
– the evolution of your workforce?
– the projects you have accomplished and those to come?
– the storytelling of an employee during onboarding?
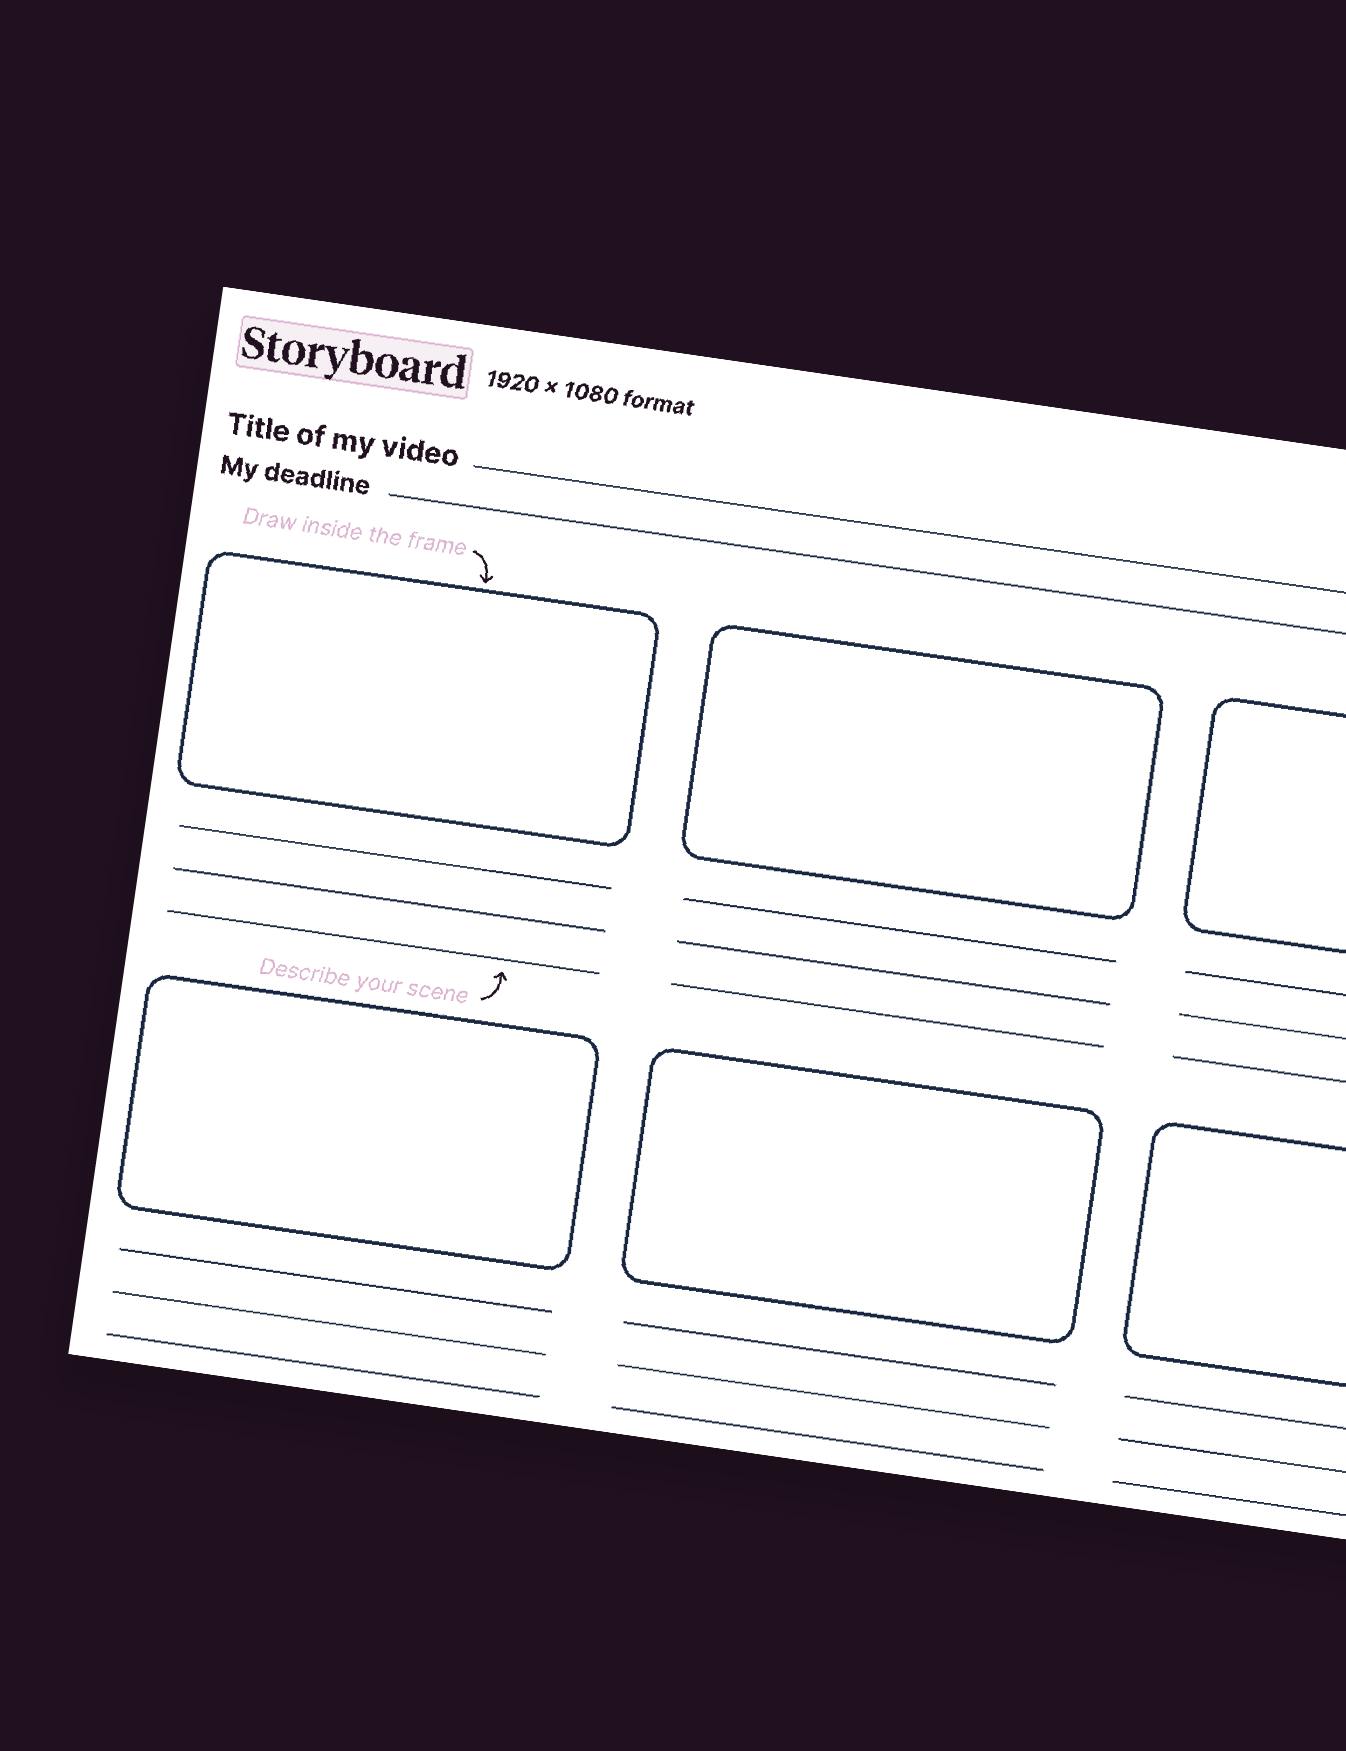
You see, before you even start your video, you must first write a storyboard to know what you are going to tell.
Compile the data and text, then, on infographic video maker, put it into images, charts or in a timeline for presentations in an infographic video
The first thing to do is not to jump straight into the video. First, you need to select the data that you think will be most relevant to your audience. Remember that your video should be short, ideally between 30 seconds and a minute and a half.
Then choose the order in which the data will appear. When editing the video, insert an animation sequence between each of them, with dynamic music, so as not to bore your audience.
Then you should start using the video creation tool, the infographics video maker
If you want to make a general storytelling including a bit of data, here are the templates we recommend on our platform:
Smart Circle, for the storytelling of an employee:
Line Drop, for an infographic video relating the success story on an employee (internal communication):
Or Socialise, for corporate storytelling:
On the other hand, if what you want to do is like a more detailed infographic with many graphs, we generally recommend the Picdata template:
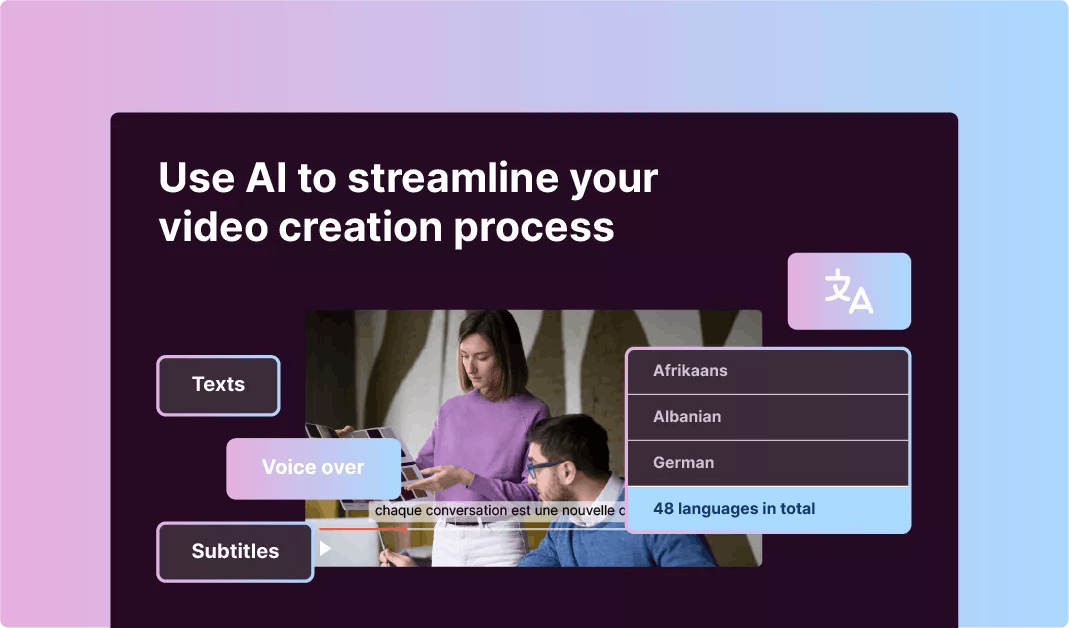
What about you? Would you like to make a good infographic, better than static infographics, with an infograhic maker? Where you could add subtitles, high-quality voice-over, charts, infographic designer, or any type of data visualisation, with motion graphics and brand guidelines? The process for making beautiful infographics for your customers on social media is pretty simple
Don’t hesitate to contact Pitchy for a demo! An easy tool made for non-designers who want to animate graphics. And watch our infographic examples.
Resources
