


Infographic Video Maker: why using infographics?

From now on, you can't miss the trend: today, to compile data, you have to make video infographics.
From now on, you can’t miss the trend: today, to compile data, you have to make video infographics with infographic video maker.
We are now in the era of all visual, all digital, and all video. Video will be the most present medium on social networks next year, and will represent more than 80% of traffic. And in general, if a trend is becoming more widespread among the population concerned, there are one or more reasons for it.
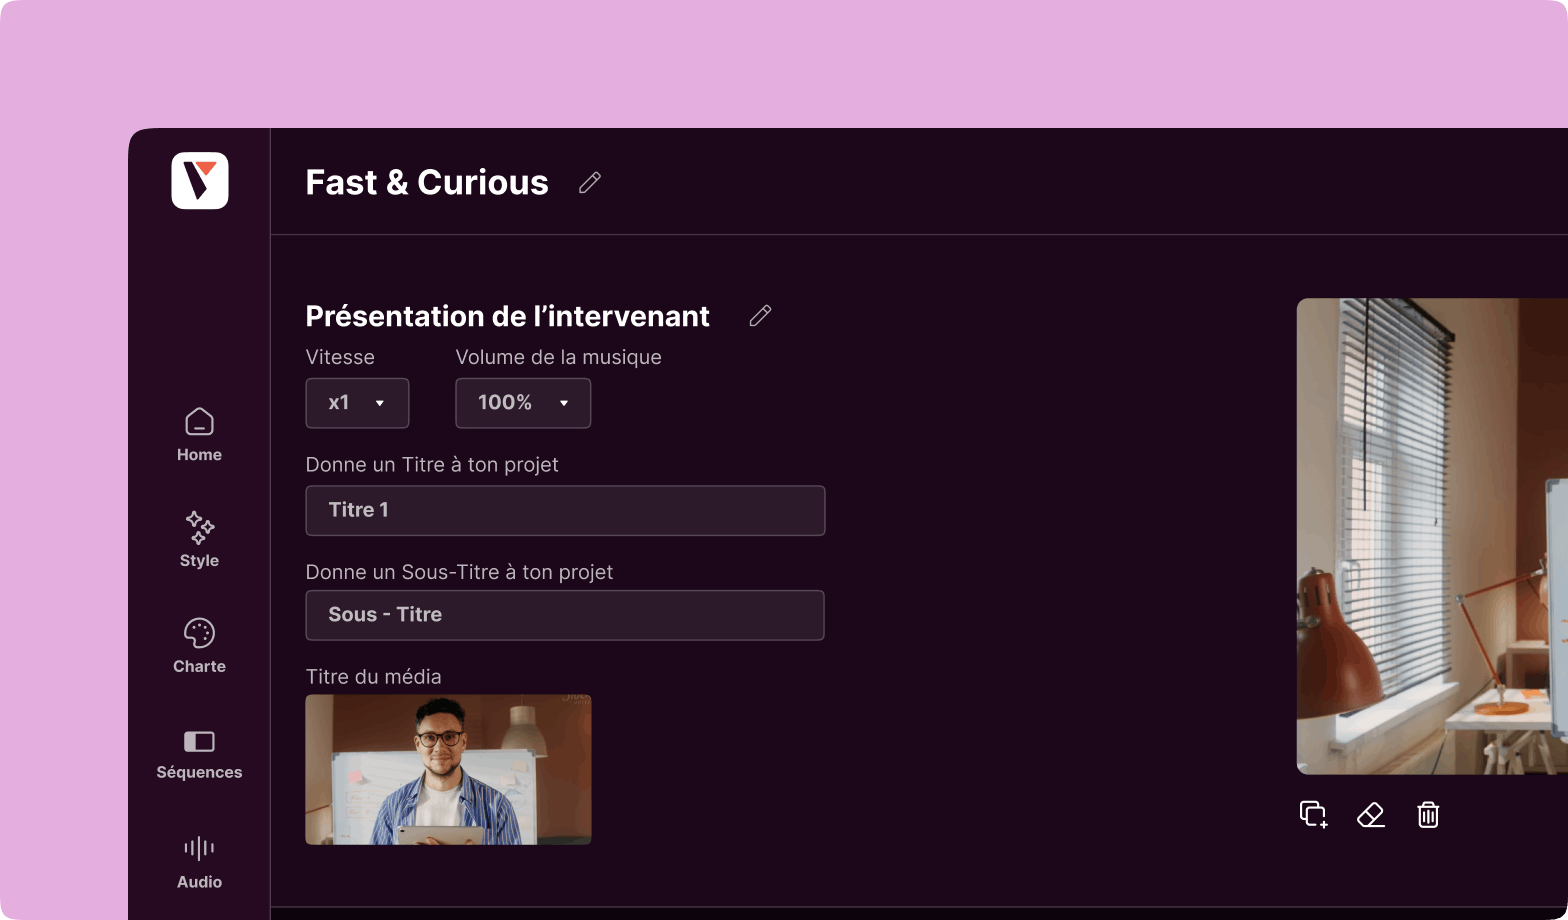
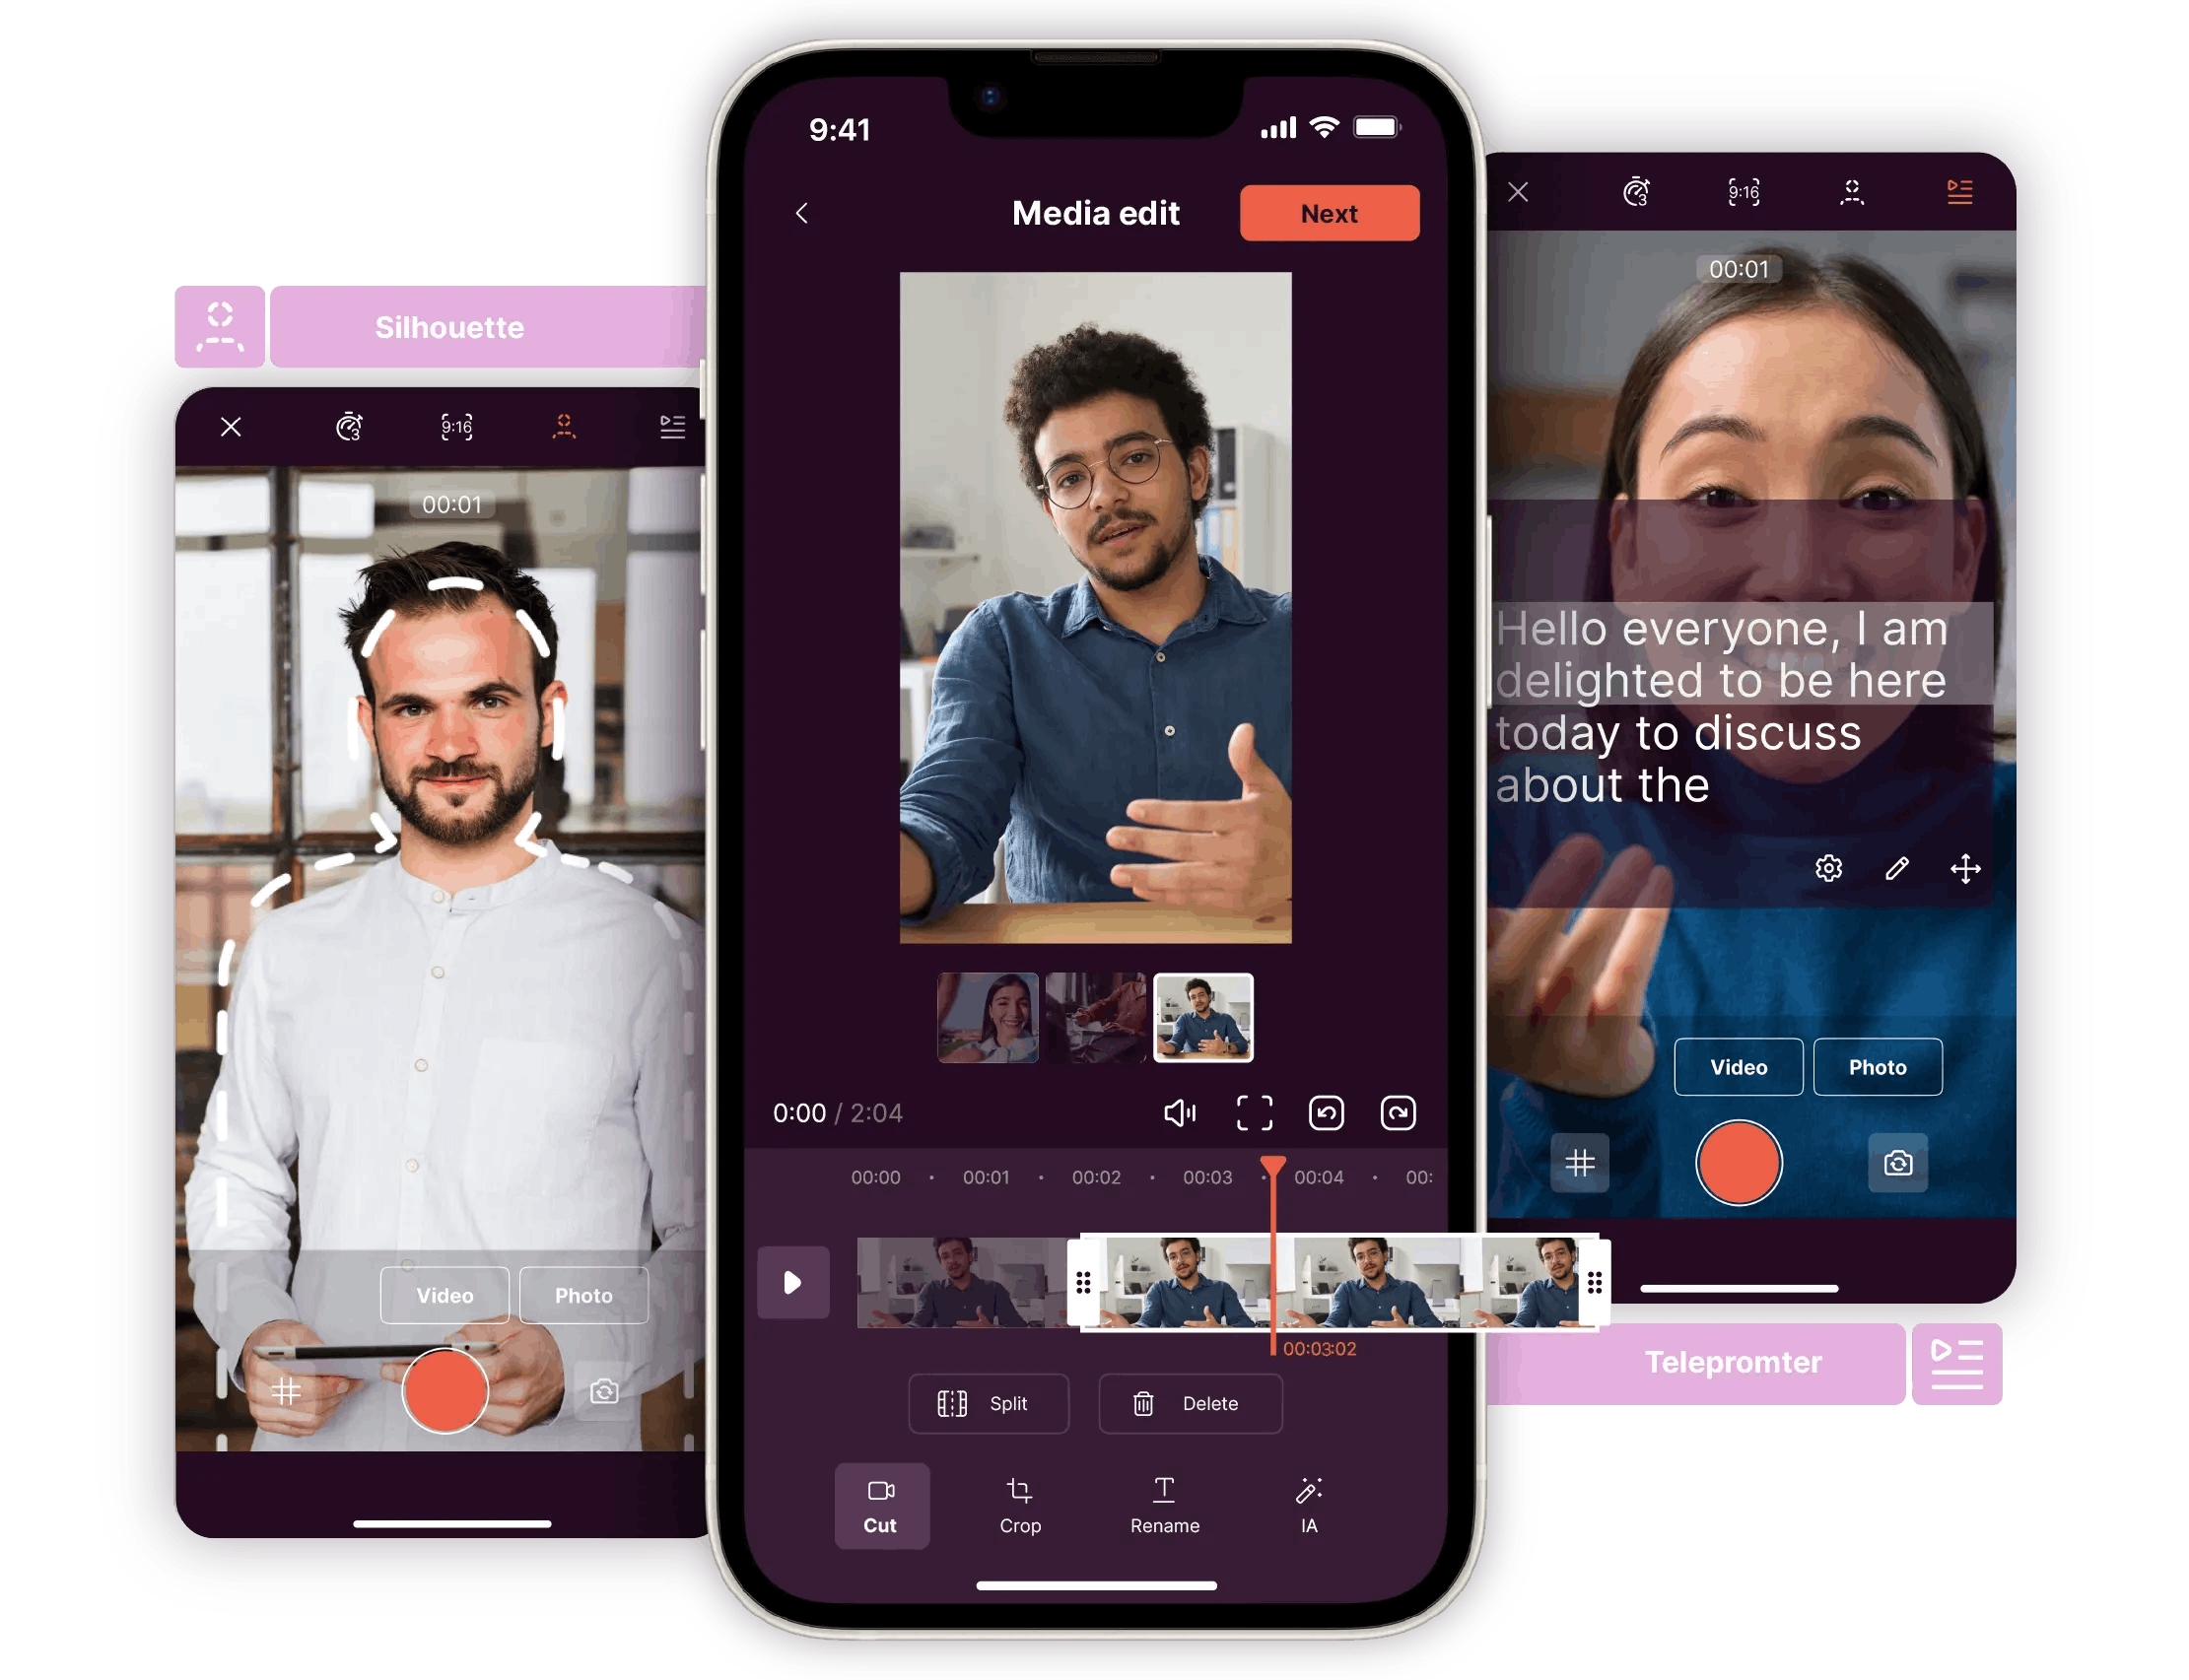
If you are a company that wants to make its own videos, you can use an online video editing tool like Pitchy. Gone are the days when you had to go through an agency!
You will find more infographic examples in this article, if you are looking for infographic design inspiration, animations, charts or diagrams.
Infographics make it easier for your audience to understand figures, statistics and timeline
Initially, making a classic infographic means putting complex figures into pictures. For example: turnover per quarter, or for marketing, all the prospect data: newsletter opening rate, click rate, etc.
Rather than having a huge table that is difficult to remember, we prefer to put the data in the form of an image.
But sometimes, even the image is not enough, because there is too much data compiled.
As a result, the teams opted for computer graphics in video: rather than having an image that is too difficult to understand, they put different illustrations in animation, to give dynamism, notably thanks to the music, the templates and the different transition sequences.
The infographic video can be used in several situations or any project, not only presentations
Internally, with your teams, you can use the infographic in the following cases:
–Activity reports: annual, monthly, as you wish. If you have compiled several figures to raise awareness of how far you have come and what still needs to be done, you can use the infographic.
Here is an example of one among beautiful infographics you can make with Pitchy:
– For in-house training: if you choose to use video as a medium for training your employees, this training can end with an infographic, taking stock of the correct answers, or the skills acquired. Firstly, it allows learners to look back on the training’s key points whenever they want so they can assimilate the information at a time that works for them. Secondly, it’s a good way to keep a record of what trainees retained so they can compare their own thoughts with others. Lastly, it’s a very effective reporting tool to record the knowledge shared and effectively prepare for any upcoming training sessions.
For performance tracking: Performance monitoring applies at the macro level, for the performance of the company, but also at the micro level, with regard to your campaigns. For example, for a marketing campaign, many KPIs will be taken into account: number of newsletter recipients, opening rate, click rate, leads generated, etc.The video infographic will therefore allow you to animate all of this data, to make it more readable for your teams.
Infographic video is by far the most viewed and shared content on social media, by all users, and whatever your market is
Just remember these figures:
- 90% of information transmitted to the brain is visual
- 65% of people are visual learners
- and 40% of people respond better to visual information than text.
In other words, video infographics with charts (or other elements) are ideal content if you want to :
– gain awareness (for example, by making an infographic to tell your story since your creation),
– generate more leads, if your post is accompanied by a registration link, a request for a product demo, etc…
By choosing video, you can be sure to gain visibility in the flood of information that scrolls across social networks.
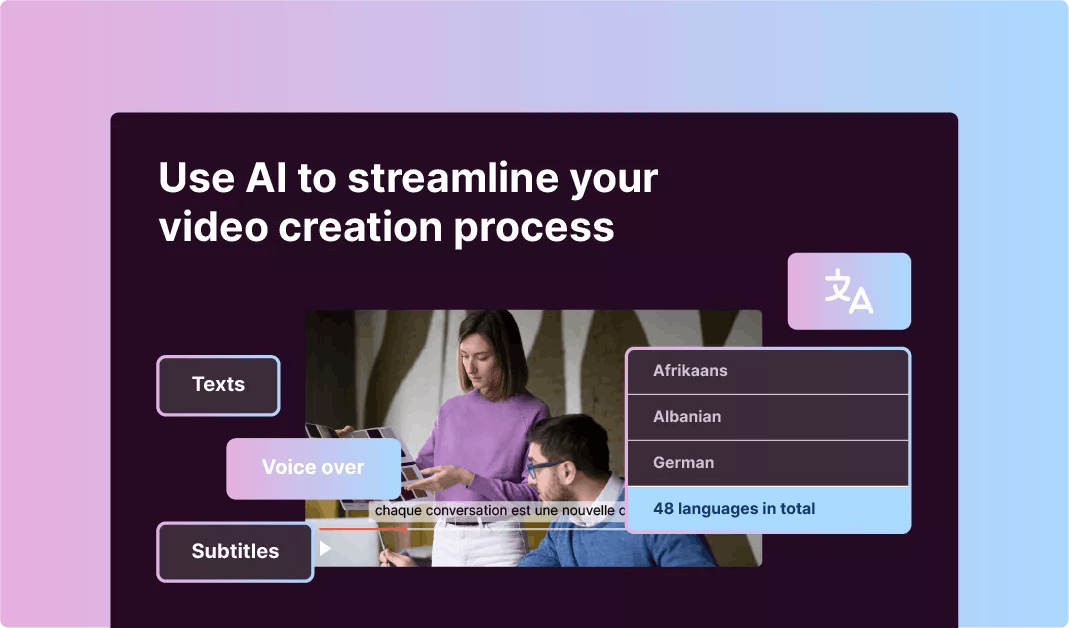
Do you also want to take control of your video creation for your brand, and use infographics regularly? Most tools for infographic video do not offer what we offer. Do you want to make professional infographic templates, with one of the best infographic makers designed for non-designers? Do you want to compile hundreds of numbers in understanable data for your audience, easy to understand, with images and graphs for viewers? Ask for a demo of the Pitchy solution.

A passionate Content Manager at Pitchy, Marc excels in designing and implementing captivating strategies, combining hard-hitting writing and in-depth analysis to bring you the best information!
Resources