


How to make an Infographic Video: a Complete Guide in 7 steps
🎬 Quick summary | 🕓 Updated on December 12, 2025
🎯 Goal: help you understand how to create an engaging infographic video that turns complex data into clear, visual, easy-to-digest content for your audience.
🧰 What you’ll learn: the key elements of an infographic video, how to structure your data, choose the right design style, animate your visuals, and use the best templates and tools to save time.
✅ Bonus: ready-to-use infographic video templates, design tips to make your message stand out, a step-by-step method to create an infographic video even without design skills.
👥 Who is it for? Marketing teams, communication managers, HR, sales teams, and any business looking to share information, statistics, or results in a clear and engaging video format.
The infographic video has become a powerful way for businesses to share information in a format people actually pay attention to. Instead of burying your audience under heavy text or static charts, this type of video brings data to life and makes your message easier to absorb. Movement, visuals, and clear design work together to guide viewers through your story without effort.
This format gives your insights more impact and makes complex topics feel accessible. With the right approach and the right tool, turning raw information into a compelling visual experience becomes a simple and intuitive process.
What is an infographic?
An infographic is a collection of images and data visualization such as pie charts and graphs, as well as minimal text to give an easy-to-understand explanation of a topic, for more professionalism. An infographic will use striking and engaging visuals to convey information quickly and easily to the targeted audience, i.e. customers, vendors, and other Internet users.
Some infographic examples made with infographic video maker include:
- Statistical infographics
- Informational infographics
- Timeline infographics
- Process infographics
- Geographic infographics
- Hierarchical infographics
- List infographics
- Resume infographics
Infographics currently use two types of data visualization: static infographic and video infographic.
Animated infographics can be declined to infinity. Everything depends on your goals and the message you want to convey to your viewers. For instance, you can create:
- simple static infographics that incorporate some visual (e.g. animated GIFs) or audio (sound effects, voiceovers) animation to capture your viewers’ attention,
- infographics in cartoon-or animated film style to make complex information simple and fun,
- interactive infographics to keep your viewers active like in a video game,
- animated videos that integrate original sequences and animated illustrations to create an original format,
- infographic tutorial to explain how your product or service works,
- chronological presentation of your company or your project,
- top 10 videos to combine educational and entertaining content,
- whiteboard videos for your training clips.
As you can see, the potentialities of animated infographics are almost limitless.
Why make an infographic video?
An infographic video is the improved version of static infographics. Generally, viewers are more attracted to data gathered in a good infographic than a blog text. Moreover, people also tend to pay more attention to information-carrying images. However, video takes infographics to another level because of their compelling quality and their ability to capture the attention of an audience.
Below are some reasons why you should make an infographic video:
To simplify complex information
Have you ever tried to read a presentation full of statistics, charts, and graphs? Then, you must know that the key information is often difficult to understand and to grasp for anyone. Consequently, an infographic video is beneficial for your business if you want to simplify your data presentations. Indeed, you will attract the attention of your viewers better with relevant images and less text.
For improved metrics
Infographic videos enable you to walk your audience through the data you are presenting them, step by step. From the initial research to the details of your findings, you will entice your audience more easily with improved metrics.
To increase credibility
Infographic videos help you present clear and specific data in a visually attractive manner. Therefore, they will help you establish your authority and credibility on your target audience about the specific topic you are dealing with.
To look great for attracting new fans and followers
Videos consistently generate the highest engagement on social media, far above text or static images. This makes infographic videos a strong option when you want to reach more people and share information in a format that feels both educational and enjoyable. The rise of video as a communication channel has accelerated this trend and turned infographics into a go-to asset for many teams.
Infographics became popular over the past decade because they simplify complex ideas and highlight key insights in a visual way. Marketers quickly adopted the format, and it continues to perform strongly today.
- 67% of B2B marketers create infographics, according to the 2020 Content Marketing Industry Report.
- 32% consider visual content a top priority for their marketing strategy.
- Video-based infographics drive stronger engagement because viewers retain information more easily through motion and storytelling.
Whether you use them for marketing, internal communication, training, or reporting, infographic videos offer dynamic storytelling that keeps your audience focused and makes your message more memorable.
Animated infographics also work great in more creative formats, like greeting card videos for internal or external use.
7 Steps to create an infographic video
Step 1: Why Should Your Infographic Video Exist?
First, take the time to define your objective and the audience you want to reach. An infographic video can serve many purposes, both inside and outside your company, and the way you build it depends on the message you want people to remember.
Internally, it can help you share information more clearly through:
- key figures or performance updates for management,
- training highlights funded by the company,
- upcoming priorities or challenges that teams need to understand.
Externally, it can support your communication by showing:
- recent achievements such as new hires or milestones,
- your presence in new markets,
- events or initiatives your teams have taken part in.
Once your objective is clear, define who will watch the video so you can choose the right tone and visuals. This is also the moment to decide whether you need subtitles for multi-platform sharing and to identify the KPIs that will help measure performance. A clear goal makes it easier to select the right content and turn your information into a coherent story.
For more ideas on how to build a compelling brand narrative, see how to use infographic video makers for corporate storytelling.
Step 2: Choose the Right Data
Infographic videos are designed to simplify complex information, so select only the most relevant and impactful data. Gather information from reliable internal or external sources, including press articles, surveys, or internal dashboards.
Once the data is collected, sort it by priority and importance. A video should be short and impactful, ideally not exceeding 2 minutes. Highlight the most significant figures such as large percentages, record results, or major achievements. Don’t hesitate to cite your sources if you’re using external data. This reinforces your credibility and shows the quality of your research.
The use of data will depend on the type of information you want to highlight: performance indicators, market trends, user behaviors, etc. For example, if you want to demonstrate the growth of a product, include sales figures over time, number of users, or customer satisfaction rate. Whether you want to present annual results or explain the evolution of a key market, selecting relevant and accurate statistics is crucial. Make sure your data is up to date and verifiable.
Step 3: Write the Script
The script plays a central role in the success of your infographic video. It shapes the way your message flows and keeps viewers connected to the narrative from the first second to the last.. A strong script sets the tone and gives your visuals a clear purpose.
To keep your message structured and easy to follow, focus on three key narrative moments:
- an introduction that sets the context and explains why the information matters,
- a core section where the essential data appears in a logical flow,
- a closing message that reinforces the takeaway and leaves a lasting impression.
A script works best when it feels like a story rather than a list of facts. A call to action can also reinforce the impact by inviting viewers to continue their journey with you.
A voice-over can support this structure, especially for internal communication. It helps people follow the storyline without relying only on on-screen text. Whether you use narration or not, your script should reflect a clear sequence that moves naturally from the issue to the insights and then to the final message.
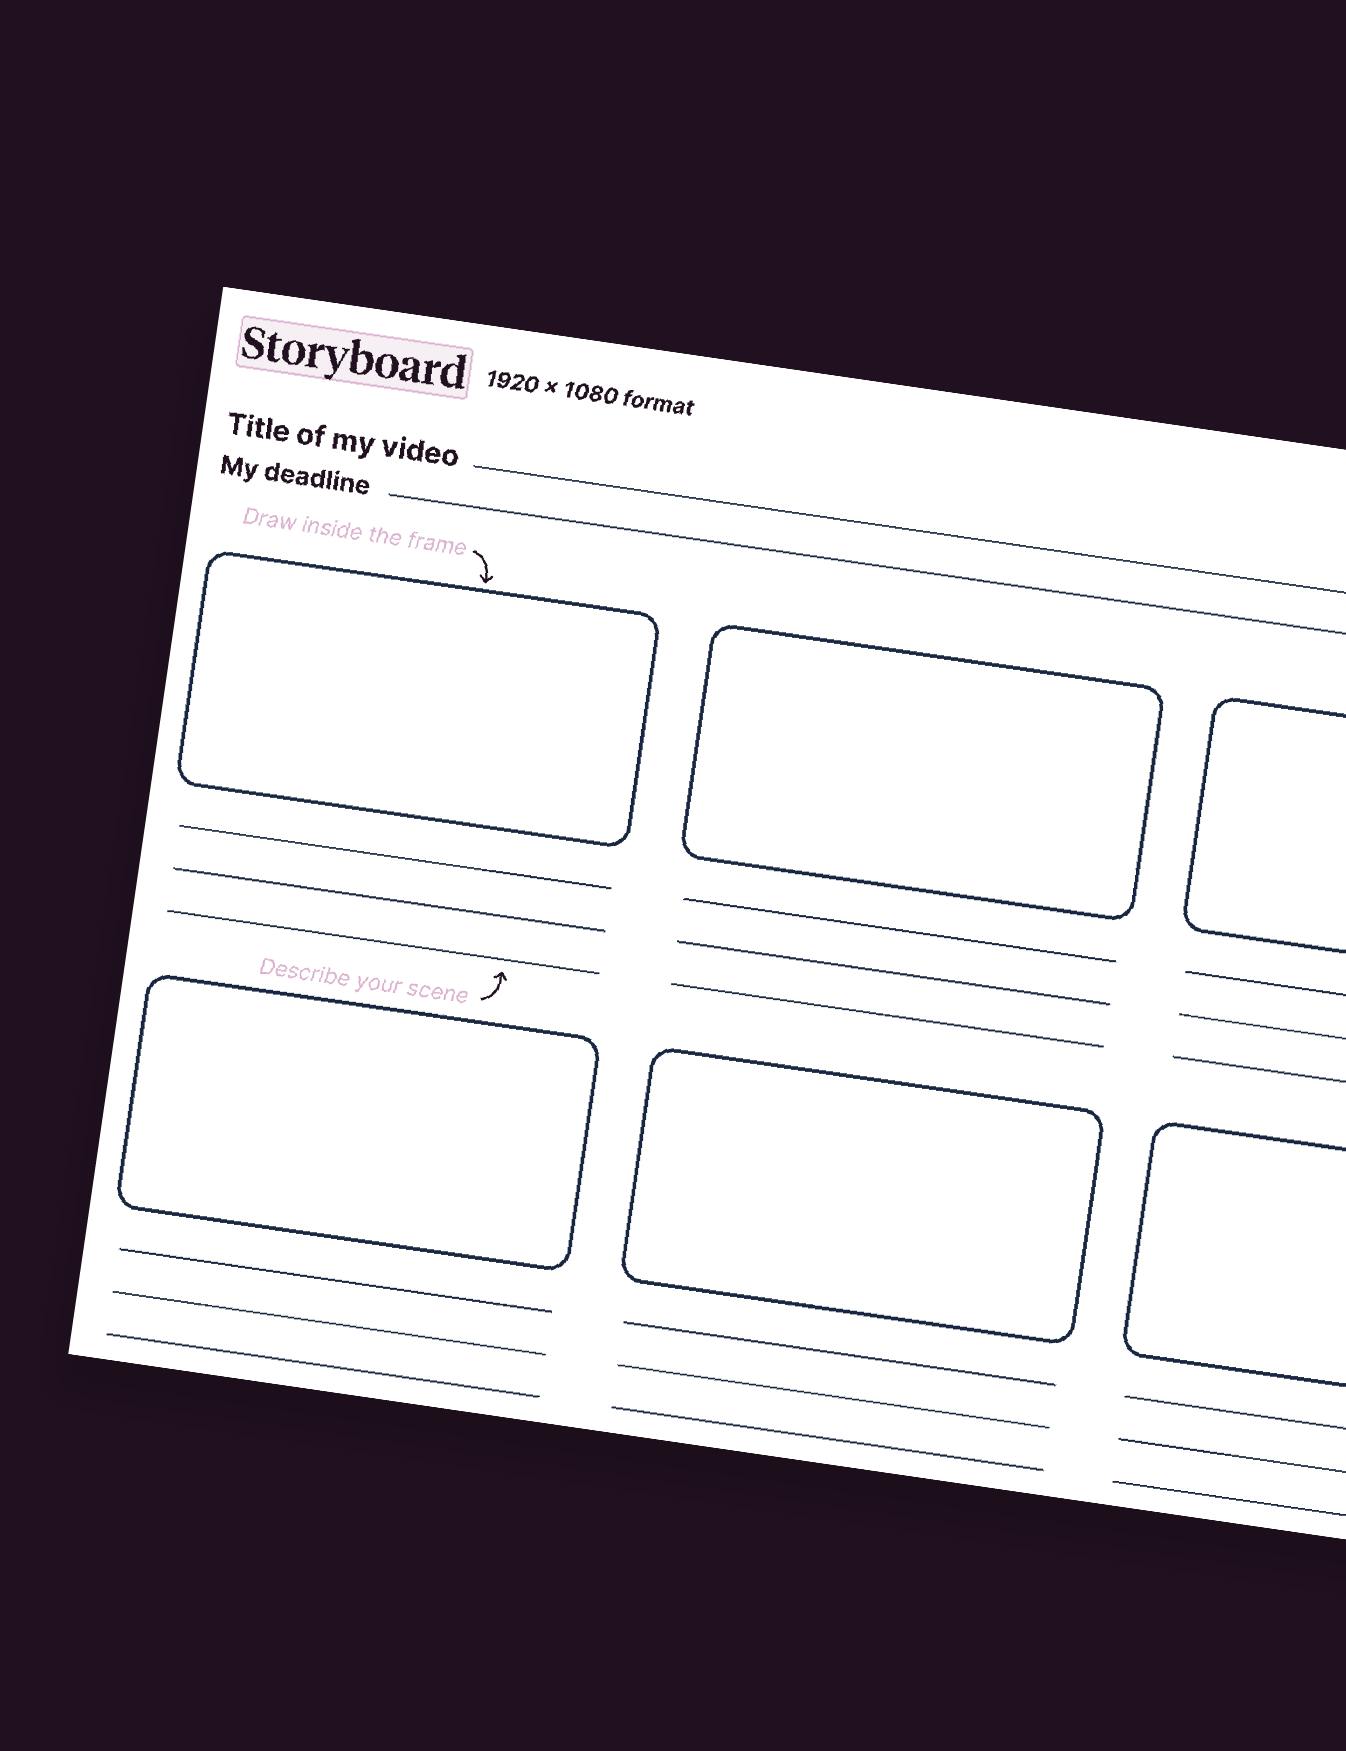
Step 4: Make Static Infographics First
Before animating, start by creating static visuals that show how your information will appear on screen. This first step gives you a solid structure and makes animation easier later. Preparing the infographic in advance also helps you imagine the flow of transitions and the rhythm of the video.
To keep everything clear and consistent, focus on:
- a coherent visual hierarchy that guides the viewer naturally,
- your brand guidelines for colors, fonts, and overall style,
- a structured layout that keeps attention on the message.
Visual elements can reinforce clarity and help your audience understand key ideas faster.
- Graphs and charts add impact to your data when you need to highlight proportions or comparisons.
- Diagrams and symbols support quick understanding when the topic becomes more complex.
- Icons and pictograms bring simplicity and make the video easier to follow.
When the design is thoughtful at this stage, the animation phase becomes smoother and the final video feels more engaging.
Step 5: Animate Your Infographic
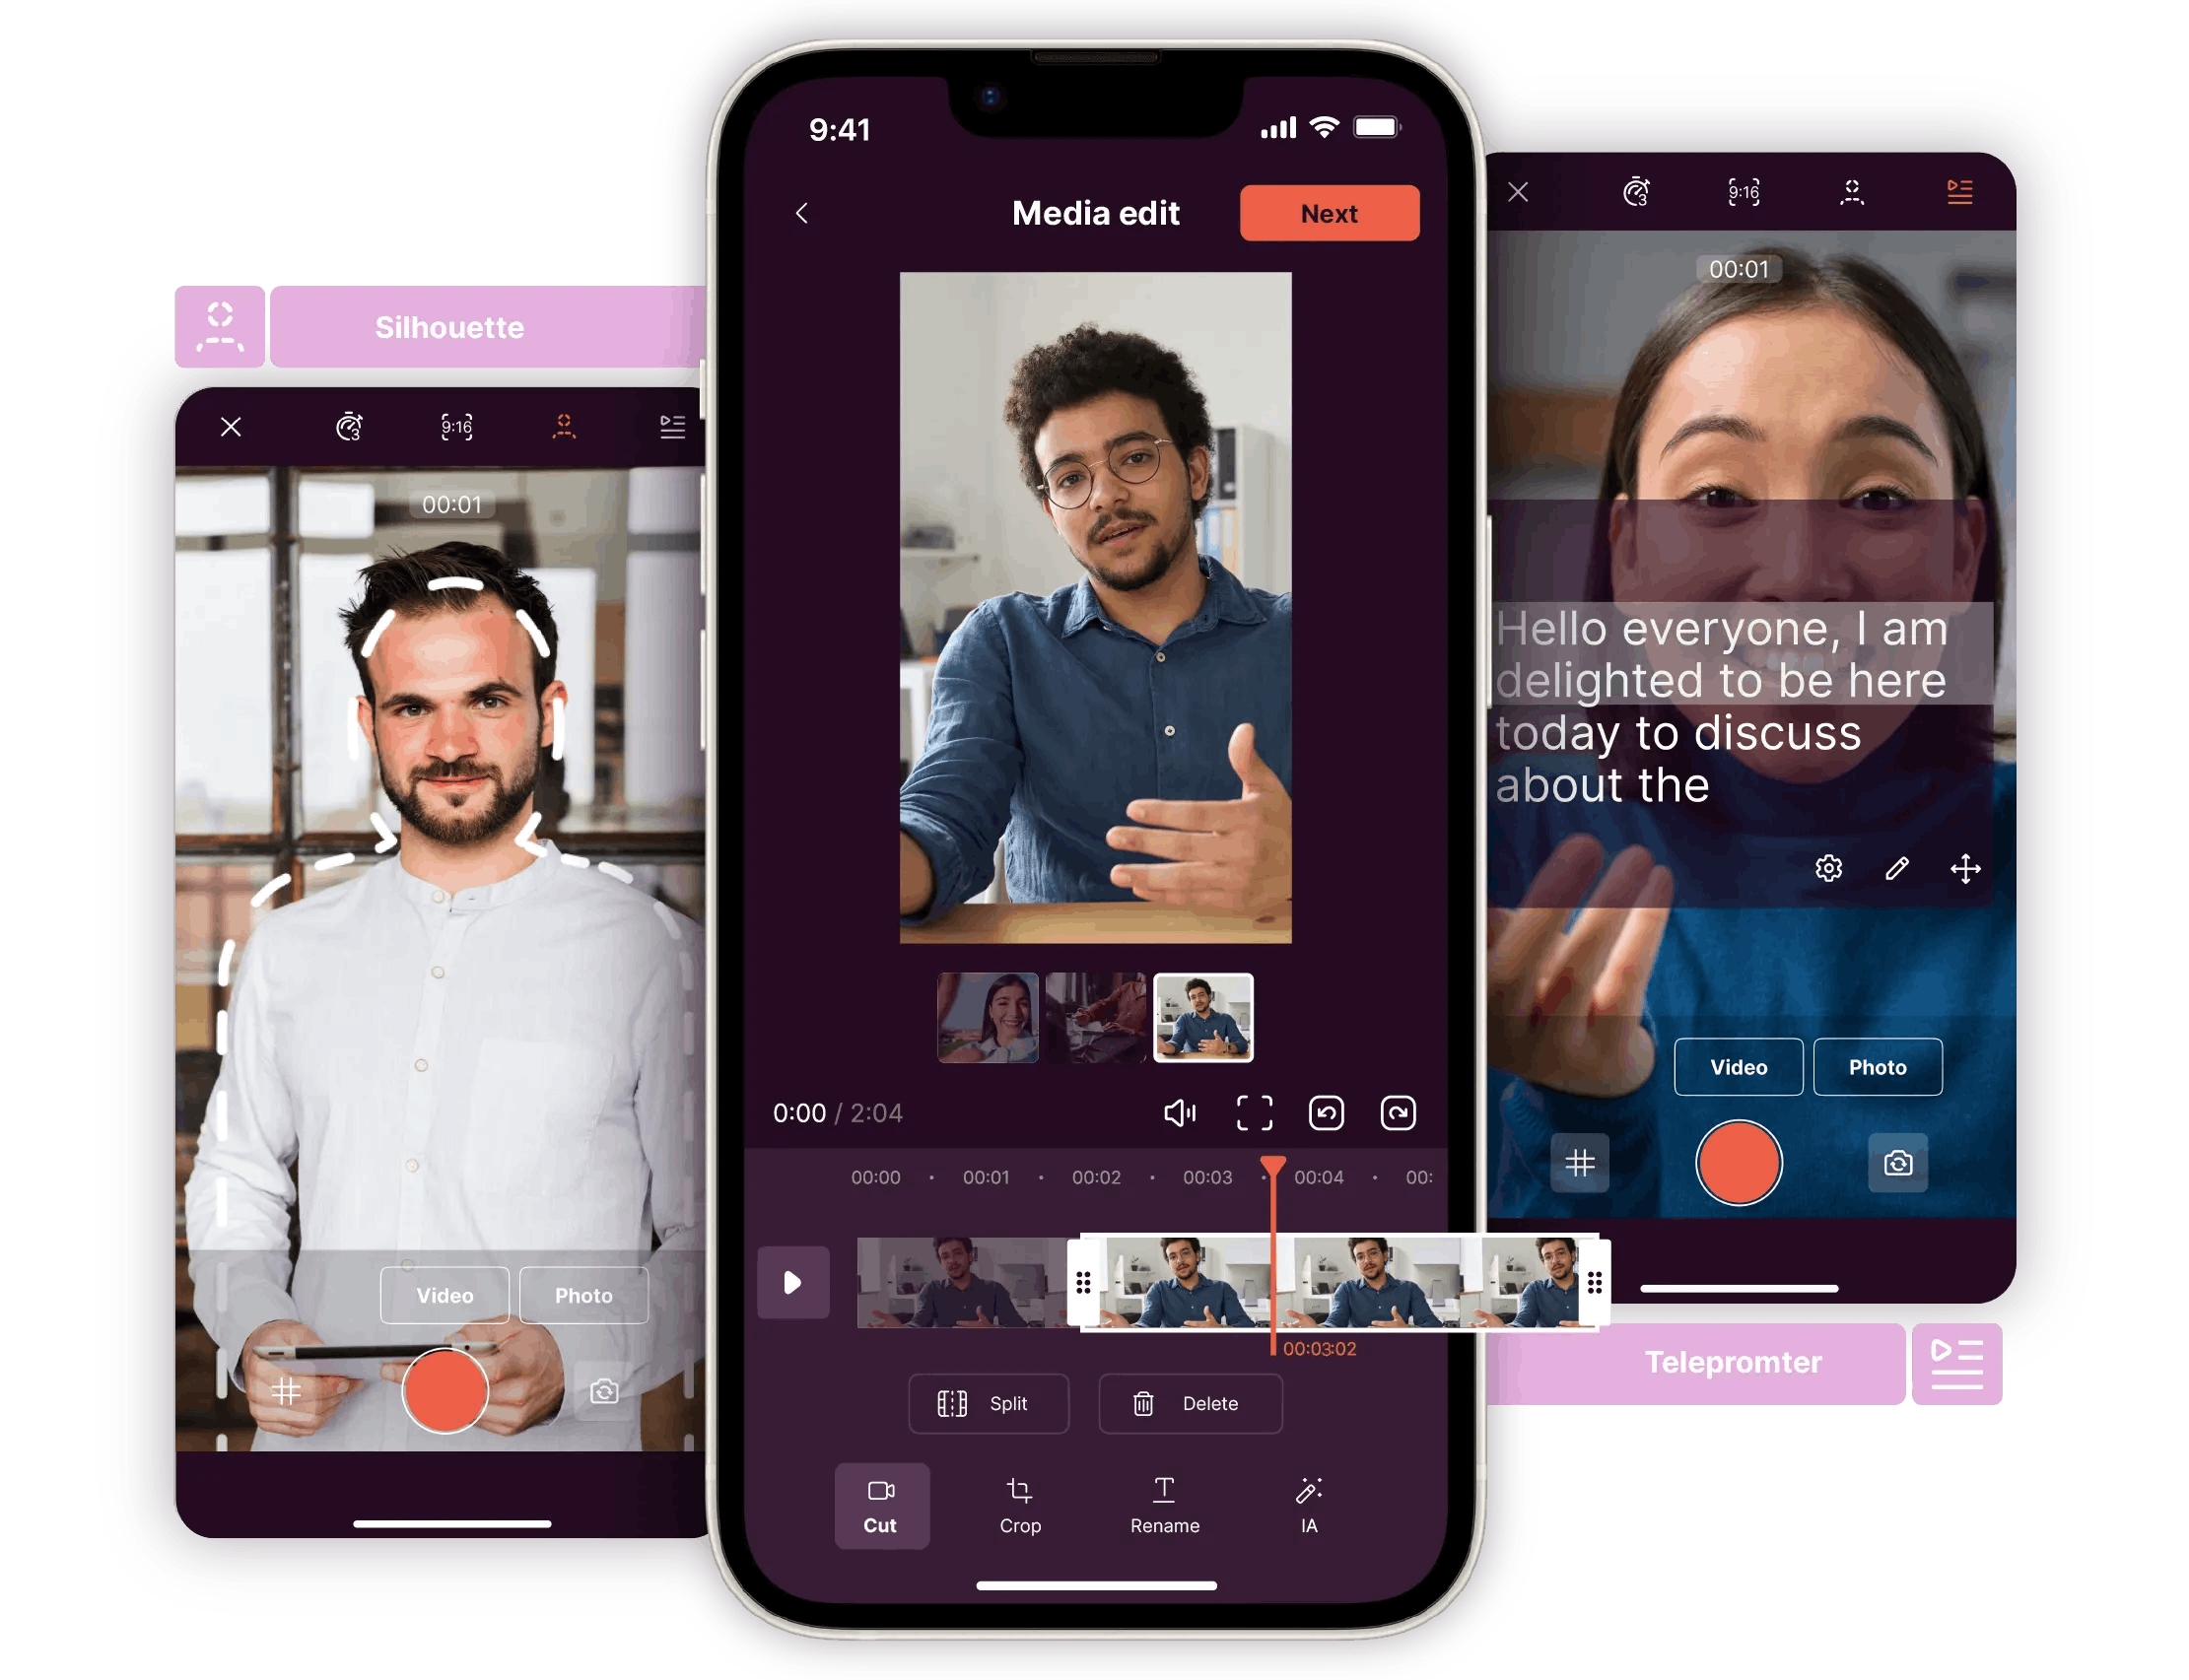
Once your visuals are ready, you can move on to animating your infographic video. Animation adds rhythm, movement, and impact to your content. You can animate each element individually or create transitions between the different sections of the video.
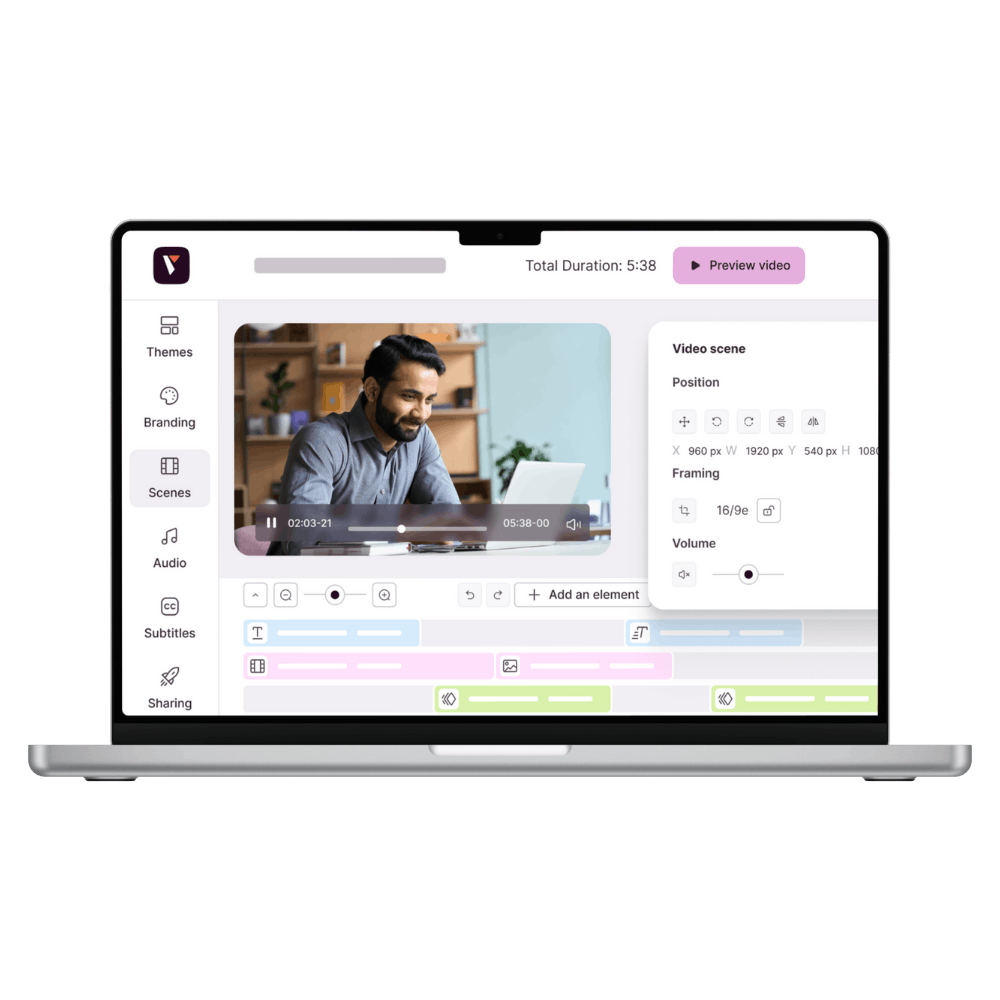
This is where the choice of software becomes crucial. Pitchy offers many templates dedicated to infographic video formats. You can also use its animation library to bring your graphics to life. Be sure to choose transitions that are smooth and consistent with your message.
Consider integrating animation to emphasize changes in data, timelines, or rankings. For example, use animated bars to show rising numbers or dynamic maps to illustrate geographical statistics. Choose animations that are simple and elegant to maintain a professional look.
You can also enhance your infographic video with motion design to create more fluid and visually captivating content.
Step 6: Add Voice-Over and Background Music
Adding a voice-over can make your infographic video more engaging and easier to understand. A voice-over guides your audience through the video, explains complex information, and reinforces key messages. Make sure the voice-over is synchronized with the animation and the visuals.
Don’t forget to add background music to support the mood and tone of your video. The music should not overpower the voice-over or visuals but rather accompany them harmoniously. For an internal audience, choose music that reflects your company culture; for an external audience, pick a tone that aligns with your brand image.
It’s important to check the licensing of music tracks, especially if your video is intended for public distribution. Royalty-free music libraries are a good option to consider.
Step 7: Edit, Review and Export Your Infographic Video
Once your visuals, animations, voice-over, and music are ready, it’s time to bring everything together. This final phase is where your infographic video takes shape, and every detail counts. Use an editing tool like Pitchy to assemble the different components into a coherent sequence. Take the time to refine the flow so your audience can follow the story without distraction.
To make sure your video delivers its message effectively:
- Adjust timings, transitions, and pacing so the rhythm feels natural from beginning to end.
- Ensure that key information stays on screen long enough to be read and understood.
- Review the entire video for clarity and visual consistency.
- Ask colleagues for feedback to spot inconsistencies or areas that might need fine-tuning.
When it’s time to export your video, make sure it fits the platform where it will be shared:
- Select the appropriate format based on whether the video is for social media, your website, or internal use.
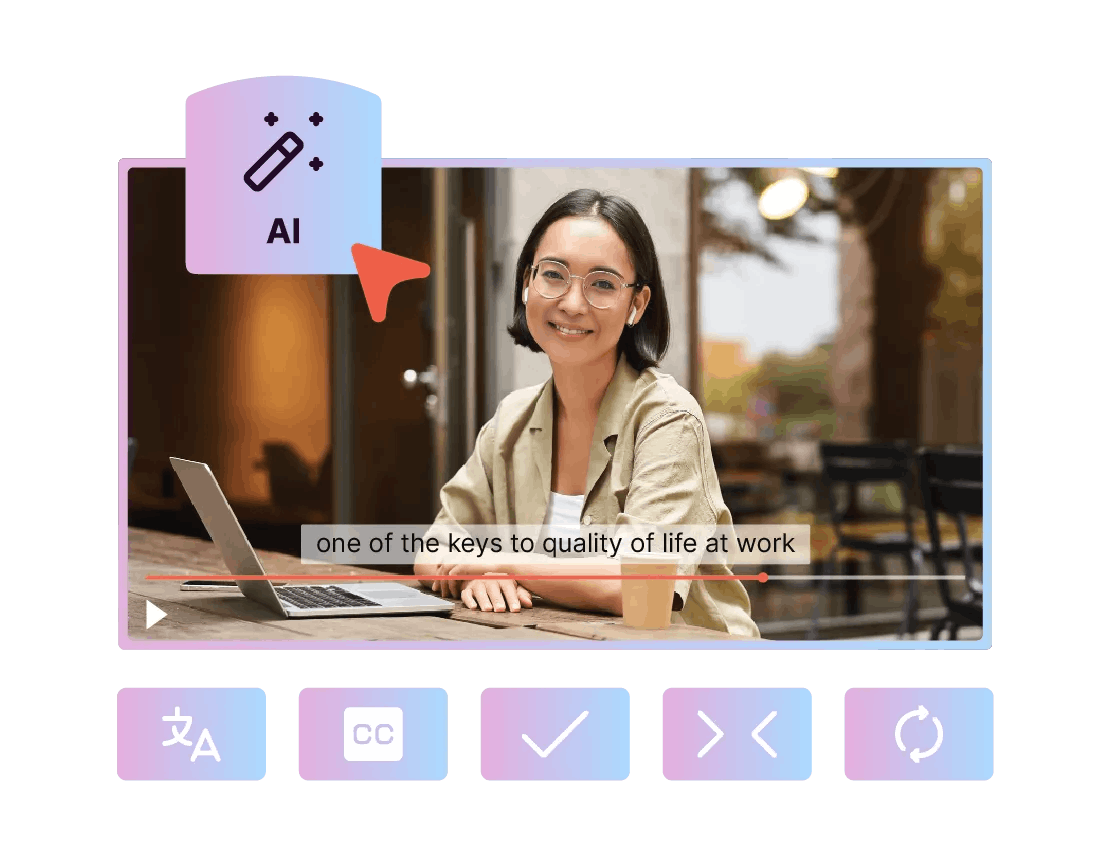
- Add subtitles to improve accessibility, especially on platforms where many people watch without sound.
- Confirm compatibility with your company’s internal channels and check that the video meets accessibility standards, including options like subtitles or sign language when needed.
For more infographic inspiration, take a look at this whiteboard animation created with Pitchy, a great example of how motion design brings data to life.
4 criteria to help you to choose the best infographic video maker
Many infographic makers are currently available on the market: Canva, Visme, or Pitchy, just to name a few. However, choosing the best infographic is not an easy process. You will have to assess several elements before making a definite choice.
- The infographic maker must be easy to use
The ideal infographic maker must have a rich library of ready-to-use media resources such as videos, pictures, music, shapes, voice-overs, and widgets. They will help you to create and edit your video infographics effectively.
- The infographic maker must have several templates and voice-over if necessary
The ideal infographic maker must contain several templates that you can adapt to your brand. They must also help you to get started quickly.
- The infographic maker must allow exchanges within your creative teams
The ideal infographic maker must enable your creative teams to share and modify their different infographic projects at ease. This is possible with the team wall of Pitchy that was specifically designed for this purpose.
- The infographic maker must help the newbies in their new projects
The ideal infographic maker must help the user to become acquainted with the software, so that he can become more autonomous all along the way. Pitchy proposes such a process with its Customer Success Manager Team which accompanies the new user on the platform.
Writer’s Note
Infographic videos always surprise me. The moment data turns into movement, people suddenly care about information they would normally skip. That’s why I love this format:it makes your information more relatable and brings a natural flow to the way your message unfolds. While writing this guide, I focused on keeping things simple, visual, and actionable, because a good infographic video shouldn’t only look great, it should work for your business.
Ready to make an amazing outro with Pitchy?
What about you? Would you like to make a good infographic, better than static infographics, with an infographic maker? Where you could add subtitles, high-quality voice-over, charts, infographic designer, or any type of data visualisation, with motion graphics and brand guidelines? The process for making beautiful infographics for your customers on social media is pretty simple.
Ask for a demo of the Pitchy solution, an easy tool made for (non-)designers who want to animate graphics and watch our infographic examples!

A passionate Content Manager at Pitchy, Marc excels in designing and implementing captivating strategies, combining hard-hitting writing and in-depth analysis to bring you the best information!
Resources
Most popular resources

Unlock the power of video marketing with user-friendly and cost-effective online video makers!
Get our all-in-one kit to kickstart your video projects effortlessly!

We'll teach you how to use video to foster employee productivity!