


How to Choose the Best Infographic Video Maker

The only question you should ask yourself as a marketer is how to choose the best infographic video maker that will suit your content and promotional needs to make this type of data visualisation.
Since its inception in the graphic design scene during the past decade, infographic has become a favorite tool for marketers and companies. Indeed, this simplified animated presentation became increasingly popular, especially with the generalization of video as a promotion tool on the Internet.
Indeed, according to the 2020 Content Marketing Industry Report, 67% of B2B marketers created infographics and 32% of marketers declared that visual images were the most important form of content for their business.
However, marketers and business people are likely to find that crafting infographics could be difficult, time-consuming, and costly. If this is your case, we have good news for you. With the new infographic video makers, you don’t need to be a graphic genius to make a good infographic video.
The only question you should ask yourself as a marketer is how to choose the best infographic video maker that will suit your content and promotional needs to make this type of data visualisation. This article will answer this question and give you some guidance on this topic to make a good infographic.
What is an infographic made with infographic video maker?
An infographic is a collection of images and data visualization such as pie charts and graphs, as well as minimal text to give an easy-to-understand explanation of a topic, for more professionalism.
An infographic will use striking and engaging visuals to convey information quickly and easily to the targeted audience, i.e. customers, vendors, and other Internet users.
Some infographic examples made with infographic video maker include:
- Statistical infographics
- Informational infographics
- Timeline infographics
- Process infographics
- Geographic infographics
- Hierarchical infographics
- List infographics
- Resume infographics
Infographics currently use two types of data visualization: static infographic and video infographic.
Static infographic
Static infographic is a presentation that uses artistic and data compilation which are highly visual and informational at the same time.
The main advantages of static infographics are their versatility and their usefulness in data aggregation. You can use this type of infographic to create a timeline, a bar graph, a description of your business assets, or your sales records.
Therefore, this is a great tool to help you promote your brand in an unprecedented way.
Video infographic
Video infographic is created with the combination of various animations to create an informational video that will help explain data in an engaging way to the viewers.
Video infographics present several advantages for marketers:
- You can integrate various types of media in your presentations that you cannot do with static infographics which rely on images only
- Information is easier to understand and is more dynamic thanks to the chain of sequences and subtitles. For this reason, they appeal more to viewers who prefer motion graphics and animations to static images
- They enhance storytelling thanks to the integration of your visual identity in the video
- They are easily sharable on social media, especially on Pinterest or Instagram
Who use infographics and infographic video maker on a daily basis?
Since infographics are fun and easy to understand, they are useful for many professions on different kinds of projects. Among them, we can quote all kinds of content creators, marketers, businesses, educators, and not-for-profit organizations.
Content creators and marketers
They use infographics to drive more traffic to their websites, to increase visibility and brand awareness, and to boost client engagement.
Educators and trainers
They use infographics to break down complex information and to make them easy to understand for their students/trainees.
Companies
They use infographics to present their business data and their companies’ financial statements in a more engaging manner for their audience: shareholders, Senior Management, employees, and other stakeholders.
Not-for-profit organizations
They use infographics to spread awareness about a social cause or issue.
Whatever your situation, you must be careful and know your needs for an infographic, according to your activity and your goals. Do you want to perform an in-house training? Do you want to present your balance sheet and your income statement in an attractive manner? Do you want to share an information about a specific cause?
According to your goals and your needs, you will choose the appropriate format for your infographics. If you are not sure of your choice, you can get inspired by Pitchy’s infographic examples that we put at your disposal.
Why is video infographic made with infogaphic video maker generally used nowadays?
Currently, video infographics have become increasingly important in the communication strategy of companies. This can be explained by several factors.
Infographics grab the attention of viewers faster
Several studies have shown that human beings tend to remember what they see more than what they read. Indeed, the human brain processes visual details 60,000 times faster than text or words. Therefore, beautiful infographics will be funnier and more engaging to any audience than plain text.
Infographics are a living testimony to your expertise
Whether you work in marketing or in other sectors, everything revolves around data and statistics. Every operation must be measured with adequate figures, charts, and percentages. Therefore, a video infographic can showcase your extensive research on a specific matter and establish your credibility on the marketplace.
Infographics makes complicated information more understandable
A video infographic makes complicated data and graphs more understandable and more dynamic to watch. It is delivered in an effective and smooth manner to the targeted audience.
Infographics boosts your brand value
Infographics go beyond telling the story behind your brand. That’s why it is very important that you include your brand guidelines in your video, such as your logo, your brand image, your visual identity, as well as your contact information.
Infographics help to boost your ranking on Internet search engines
Content with relevant images such as infographics gets 94% more views than content without relevant images. Consequently, like any other high-quality content, viewers who will use your infographics are more likely to link back to your website as the source. This helps your website to get higher rankings in Internet search engines, such as Google, Yahoo!, or Bing.
4 criteria to help you to choose the best infographic video maker
According to the 2020 Content Marketing Industry Report, 43% of content marketers said that creating visual content like infographics is their biggest challenge. For a long time, marketers and companies used to look for an infographic designer to help them, incurring more costs for them.
However, with the arrival of infographic makers on the markets, those days are gone. Nowadays, non-designers and complete newbies can create an infographic online, without being creative geniuses. Many infographic makers are currently available on the market: Canva, Visme, or Pitchy, just to name a few.
However, choosing the best infographic is not an easy process. You will have to assess several elements before making a definite choice.
Element #1: The infographic maker must be easy to use
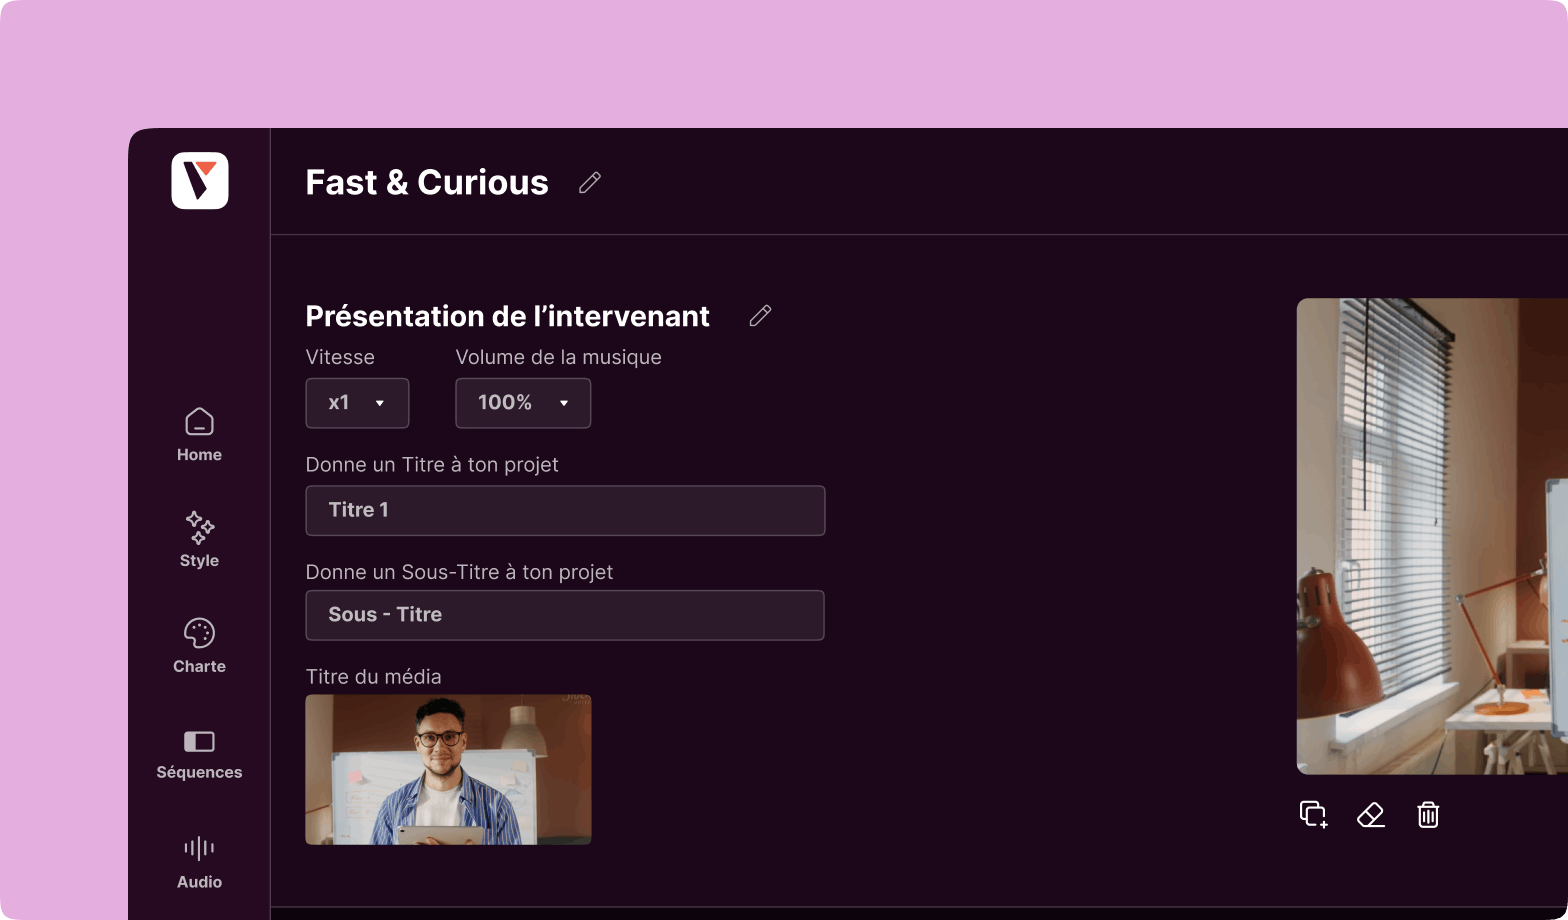
The ideal infographic maker must have a rich library of ready-to-use media resources such as videos, pictures, music, shapes, voice-overs, and widgets. They will help you to create and edit your video infographics effectively.
Element #2: The infographic maker must have several templates and voice-over if necessary
The ideal infographic maker must contain several templates that you can adapt to your brand. They must also help you to get started quickly.
Element #3: The infographic maker must allow exchanges within your creative teams
The ideal infographic maker must enable your creative teams to share and modify their different infographic projects at ease. This is possible with the team wall of Pitchy that was specifically designed for this purpose.
Element #4: The infographic maker must help the newbies in their new projects
The ideal infographic maker must help the user to become acquainted with the software, so that he can become more autonomous all along the way. Pitchy proposes such a process with its Customer Success Manager Team which accompanies the new user on the platform.
Contact Pitchy to create your first video infographic made with infographic video maker
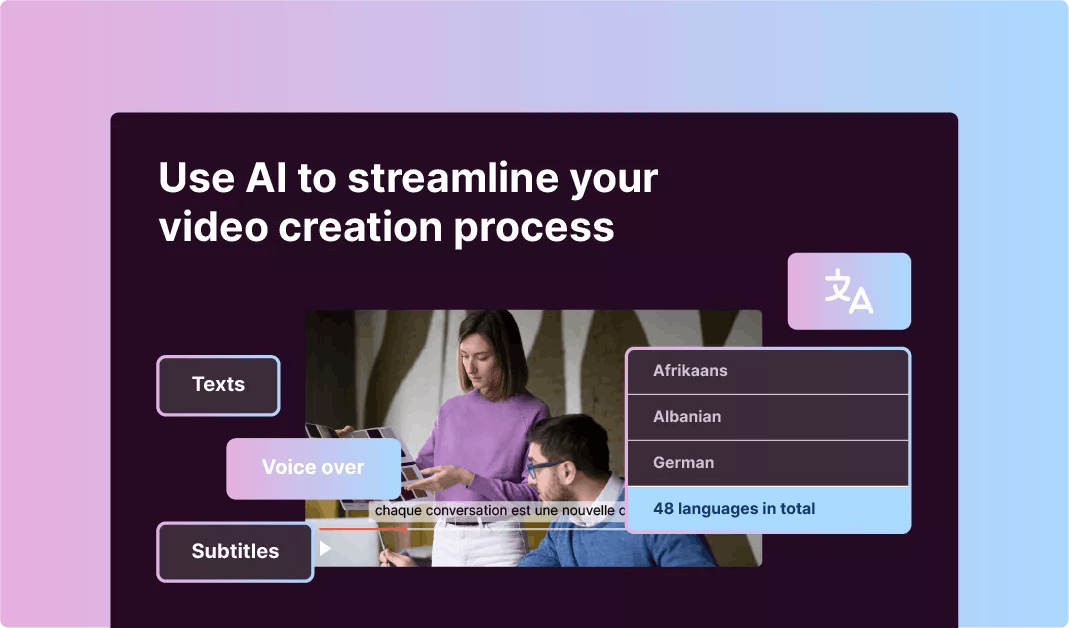
What about you? Would you like to make a good infographic, better than static infographics, with an infograhic maker? Where you could add subtitles, high-quality voice-over, charts, infographic designer, or any type of data visualisation, with motion graphics and brand guidelines? The process for making beautiful infographics for your customers on social media is pretty simple
Ask for a demo! Pitchy is an easy tool made for non-designers who want to animate graphics. And watch our infographic examples.

A passionate Content Manager at Pitchy, Marc excels in designing and implementing captivating strategies, combining hard-hitting writing and in-depth analysis to bring you the best information!
Resources